Introduction & Executive Benchmark
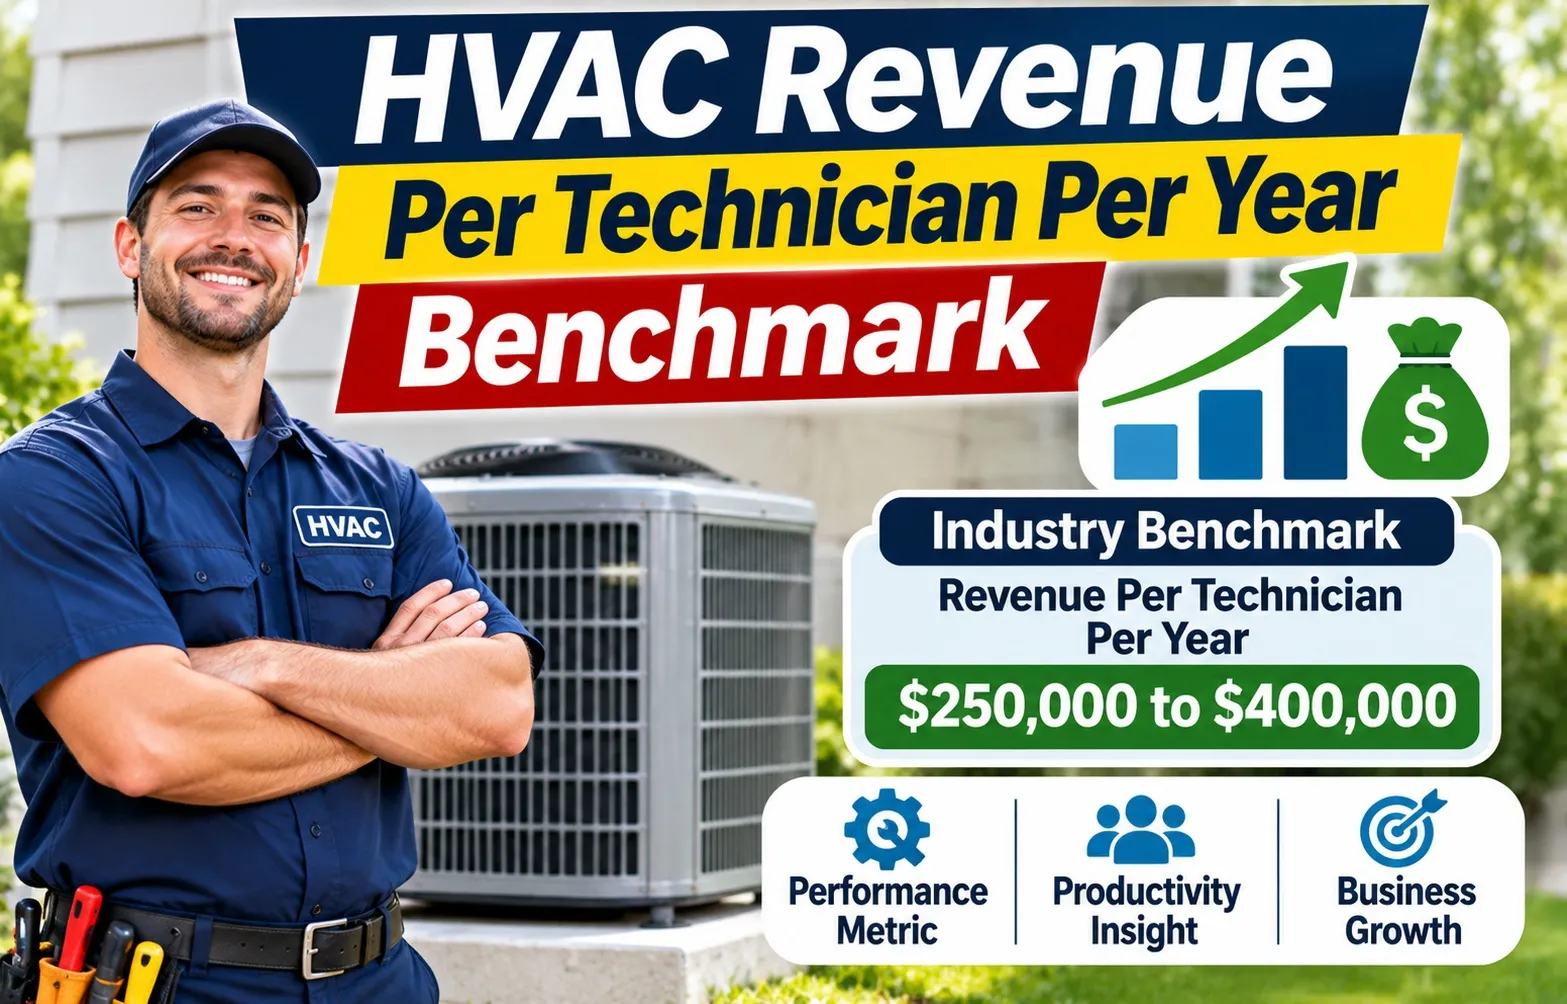 The annual revenue generated per HVAC technician typically ranges from $180,000 to $350,000, serving as the foundational key performance indicator for evaluating field service productivity and operational health. HVAC business owners and operations managers track this metric to diagnose whether their field teams are operating at a loss, hitting industry averages, or scaling in the top performance tier.
Tracking annual technician revenue stops the guesswork in labor pricing, dispatch efficiency, and gross profit margins. Rather than treating field output as a simple financial report card, elite contractors use this benchmark as a diagnostic tool to uncover hidden capacity bottlenecks.
What is HVAC Revenue Per Technician Per Year?
HVAC revenue per technician per year is calculated by taking the total annual gross revenue generated strictly by billable field technicians and dividing it by the total number of full-time equivalent technicians on staff. This metric measures how efficiently labor hours are converted into billable dollars through service repairs, maintenance agreements, and equipment replacements.
Maximizing this number requires balancing three critical operational drivers:
- Technician Utilization: Minimizing unbilled windshield time and maximizing daily billable call windows.
- Average Ticket Size: Combining standard diagnostic calls with profitable repair options and replacement leads.
- Service-to-Install Mix: Maintaining an optimal ratio between low-ticket maintenance checks and high-ticket system replacements.
Industry Benchmark Performance Tiers
Categorizing your service operations into performance quartiles allows for an immediate business self-diagnosis, highlighting whether your team suffers from low billable hours or thrives on high-conversion replacement sales. Evaluating underperforming shops against elite operators uncovers critical gaps in dispatch efficiency and pricing discipline.
Bottom Quartile ($80,000 – $150,000): The Low-Utilization & Unbilled-Time Trap
Shops falling into the bottom quartile struggle with severe operational friction, excessive unbilled windshield time, and outdated pricing books that fail to cover fully loaded labor costs. Underperforming HVAC shops in this tier often treat technical skills as the primary revenue driver while ignoring route density and call qualification rules.
Key operational characteristics driving low technician revenue in this bracket include:
- Excessive drive time between service calls due to poor route planning and wide geographic dispatching.
- Outdated flat-rate pricing that undercharges for diagnostic time and minor parts repairs.
- Lack of structured training on presenting repair options and safety maintenance recommendations to homeowners.
- High technician turnover driven by low commission earnings and inconsistent work availability.
Industry Median ($150,000 – $220,000): Service-Heavy with Inconsistent Pricing
The industry median represents traditional service-heavy operations that rely heavily on maintenance agreements and reactive repair calls without a structured replacement pipeline. Contractors in this range maintain steady workflow but experience stagnant growth because technicians lack consistent sales process training.
Core operational traits defining median-performing shops involve:
- A heavy reliance on low-cost tune-ups and seasonal preventive maintenance campaigns.
- Inconsistent pricing discipline where individual technicians discount major repairs out of fear of customer pushback.
- Moderate billable-hour utilization hampered by unoptimized dispatch software and manual scheduling bottlenecks.
- Missed equipment replacement opportunities due to a failure to transition service calls into comfort consultations.
Top Quartile ($220,000 – $320,000): Solid Dispatch & Balanced Service/Install Operations
Top-quartile shops achieve high financial productivity by pairing rigorous dispatch efficiency with a balanced mix of recurring maintenance, profitable repairs, and consistent system replacements. These businesses treat route optimization and labor utilization as core drivers of field profitability.
Distinguishing factors of top-quartile operations include:
- Advanced dispatch routing software that maximizes geographic density and minimizes unbilled travel miles.
- Strict adherence to standardized flat-rate pricing books across all active field technicians.
- Clear handoff procedures from maintenance technicians to dedicated installation or sales specialists.
- High billable-hour capture rates driven by automated customer reminders and optimized scheduling windows.
Top Decile Elite Performers ($320,000 – $450,000+): High-Conversion Sales & System Replacement Focus
Elite performers operate at the pinnacle of field productivity by utilizing dedicated comfort advisors, high-conversion sales workflows, and heavy system replacement volumes. These operations generate exceptional annual revenue per technician by transforming standard service calls into comprehensive home energy upgrades.
Characteristics separating elite top-decile shops from standard operators feature:
- Deployment of specialized sales technicians and comfort advisors trained in consultative closing techniques.
- Aggressive call qualification protocols that ensure senior techs handle high-intent diagnostic and replacement opportunities.
- Streamlined financing options that drastically increase average ticket sizes on major system changeouts.
- Maximized labor productivity supported by dedicated warehouse runners and internal logistics management.
Benchmarks Breakdown by Specific Technician Role
Evaluating your field staff using a single blended average creates false benchmarks because revenue capabilities vary drastically by operational role. A maintenance technician focusing on low-ticket inspections should never be measured against a selling technician or replacement sales specialist who generates high-ticket equipment installs.
Breaking down revenue performance by specific field roles enables business owners to set accurate targets, align commission incentives, and identify exactly where performance leaks occur across the service pipeline.
Maintenance & Tune-Up Technicians ($120,000 – $220,000)
Maintenance technicians focus primarily on seasonal tune-ups, multi-point system inspections, and routine preventive care. Because their primary objective is customer retention and system reliability rather than major component repairs, their individual average ticket size remains relatively low.
Operational targets and expectations for maintenance techs include:
- Average ticket values typically range between $99 and $250 per visit.
- Primary revenue growth relies on club membership renewals and identifying minor wear-and-tear component replacements.
- High-performing maintenance techs excel at generating warm replacement handoffs for senior service specialists or sales comfort advisors.
Residential Diagnostic & Repair Service Techs ($180,000 – $325,000)
Residential diagnostic repair technicians handle demand service calls, system breakdowns, and complex electrical or mechanical troubleshooting. These technicians drive steady gross profit by executing component repairs, motor replacements, and refrigerant leak remediations using standardized flat-rate pricing books.
Core performance metrics for diagnostic repair specialists feature:
- Average repair tickets generally range from $350 to $900 per call.
- Revenue capacity relies on high billable-hour utilization and maintaining strong first-time fix rates to avoid unpaid callbacks.
- Techs boost production by offering tiered repair choices, such as good-better-best component upgrade options.
Senior Diagnostic & Replacement Sales Techs ($275,000 – $475,000+)
Senior diagnostic and selling technicians handle high-intent service calls on aging equipment (typically 10 to 15+ years old). Also operating as hybrid comfort advisors, these specialists diagnose system failures while presenting homeowners with energy-efficient replacement options when repairs are no longer cost-effective.
Key drivers separating elite selling technicians include:
- Average ticket sizes increase dramatically to $3,000 – $8,000+ due to direct system sales and major equipment upgrades.
- High conversion rates on replacement quotes turn routine diagnostic calls into high-revenue installations.
- Strong presentation skills allow techs to articulate financing options, utility rebates, and long-term energy savings to homeowners.
System Installers & 2-Man Installation Crews ($300,000 – $650,000+)
System installation crews operate under a volume-based production model where revenue is tied directly to completed equipment changeouts and ductwork modifications. Evaluating installation performance requires measuring the total crew output using an installation crew multiplier rather than judging installers as solo service techs.
Production standards for 2-man installation crews require:
- Generating $8,000 to $18,000+ per full system replacement job completed.
- Completing 1 to 2 complete residential system changeouts per working day depending on job complexity and labor availability.
- Maximizing labor throughput by utilizing warehouse pre-staging, prefabricated sheet metal, and dedicated delivery runners.
Light Commercial HVAC Technicians ($220,000 – $425,000)
Light commercial HVAC technicians manage rooftop units (RTUs), split systems, and commercial refrigeration for retail spaces, offices, and industrial facilities. Commercial technician
The Core Drivers Behind Revenue Variance
Understanding why one technician generates $150,000 while another produces $350,000 requires analyzing core operational variables rather than relying on technical skill alone. Factors such as service-to-replacement mix, regional weather patterns, route density, and pricing discipline directly dictate annual field productivity.
Field service businesses that actively measure and manage these key performance indicators consistently outpace competitors in gross revenue and profit margins.
Service vs. Replacement Mix (The 50/50 Revenue Ratio)
The proportion of low-ticket maintenance repairs compared to high-ticket equipment changeouts forms the single largest variable in total annual technician output. Service-heavy shops relying solely on $150 repair tickets hit natural revenue ceilings quickly due to finite labor hours in a day.
Balancing service calls with replacement opportunities creates a stable, high-yielding revenue pipeline:
- Pure Service & Maintenance Shops: Cap out around $150,000 to $220,000 per technician annually due to smaller individual ticket sizes and limited billing windows.
- Replacement-Heavy Operations: Achieve $300,000 to $450,000+ per technician by turning major equipment failures into high-ticket installations.
- The Ideal 50/50 Revenue Ratio: Blending recurring maintenance agreements with steady replacement conversions stabilizes cash flow while maximizing billable rates per field hour.
Regional Climate Modifiers (Sunbelt vs. Northeast vs. Midwest vs. West Coast)
Geographic location and local climate volatility directly dictate annual equipment runtime, emergency call volume, and seasonal earning capacity. Contractors operating in year-round cooling zones experience steady demand, whereas northern shops contend with sharp seasonal swings between heating and cooling seasons.
Regional variations impact technician benchmarks in several distinct ways:
- Sunbelt & Southern Regions: High cooling Tonnage runtime generates steady year-round replacement and repair demand, driving 15% to 20% higher annual technician benchmarks.
- Northeast & Midwest Markets: Extreme weather spikes during deep winter freezes and summer heat waves create compressed, high-intensity earning seasons followed by slower shoulder months.
- West Coast Markets: Moderate coastal climates yield lower overall emergency breakdown volume, requiring shops to rely heavily on indoor air quality (IAQ) upgrades and high-efficiency heat pump retrofits.
Billable-Hour Capture & Route Density (Overcoming Windshield Time)
Unbilled travel time between job sites represents one of the largest profit leaks in field service management. The average HVAC technician spends up to 30% to 40% of their workday driving, stuck in traffic, or waiting for parts at supply houses, directly slashing available billable hours.
Optimizing dispatch logistics and route density dramatically expands daily billing capacity according to MarginPlug financial benchmarks:
- Target a minimum 65% to 75% billable-hour utilization rate across your active service roster.
- Cluster daily dispatch calls by ZIP code to minimize windshield time and fuel consumption.
- Implement automated call qualification to ensure technicians carry the correct parts, reducing secondary trips to supply houses.
Price Book Discipline & Preventing Under-Quoted Jobs
Inconsistent pricing strategies and manual time-and-materials calculations routinely strip 15% to 25% of potential gross revenue from a shop’s bottom line. Allowing field technicians to discount repairs or estimate jobs on the fly leads to under-quoted labor and compressed gross profit margins.
Enforcing strict flat-rate price book discipline ensures uniform profitability across all service calls:
- Eliminate manual labor-and-parts estimates by adopting digital flat-rate pricing software across all mobile tablets.
- Regularly update price books to absorb rising equipment overhead, material costs, and technician wage inflation.
- Implement standardized repair options (Good, Better, Best) to increase average ticket sizes cleanly without high-pressure sales tactics.
Revenue Per Tech vs. Net Profitability (The Math Breakdown)
Generating high revenue per technician is a vanity metric if your operational expenses erode net profitability. A shop generating $350,000 per technician can easily lose money if labor rates, overhead absorption, and unbilled hours are not accurately factored into job pricing.
Protecting your business requires looking beyond gross numbers to ensure every billable hour yields a sustainable gross profit margin that fully absorbs company overhead.
Why High Revenue per Tech Can Still Cause Net Losses
Focusing strictly on top-line revenue blinds business owners to the hidden costs of scaling field service teams. High-revenue shops often suffer from bloated overhead, excessive unbilled labor, and aggressive discounting designed to close volume rather than profit.
Common operational pitfalls that turn impressive top-line revenue into net losses include:
- Excessive Warranty & Callback Work: Free recall visits consume billable technician hours while incurring unrecoverable labor expenses.
- Uncontrolled Overhead Expansion: Scaling office staff, fleet leases, and software subscriptions faster than billable field hours can support.
- Margin Erosion via Discounting: Chasing high-ticket system replacements at low margins to boost trailing 12-month revenue without protecting net earnings.
Fully Loaded Hourly Labor Costs ($55–$80+/hr) vs. Overhead Scaling
Calculating profitability begins with understanding a technician’s fully loaded hourly cost. An HVAC technician paid $30 to $40 per hour in base wages actually costs a business $55 to $80+ per hour once payroll taxes, workers’ compensation, health benefits, vehicle insurance, fuel, and specialized tooling are factored in.
Key components that build up a technician’s true fully loaded hourly cost include:
- Base Wages & Overtime Premiums: Hourly pay plus seasonal overtime burdens.
- Mandatory Taxes & Benefits: FICA, unemployment insurance, health insurance, and retirement match contributions.
- Fleet & Equipment Allocation: Van lease payments, vehicle maintenance, fuel cards, auto insurance, and specialized field tools.
- Non-Billable Labor Burden: Paid weekly training, shop meetings, unbilled travel time, and paid time off (PTO).
The Exact Formula to Calculate Your Shop’s Target Revenue Per Tech
To establish an accurate, profitable target revenue per technician, use a formula that ties fully loaded labor costs and allocated non-tech overhead directly to your target net profit margin or Seller’s Discretionary Earnings (SDE).
Calculate your required revenue target per technician using this core industry formula:
For example, if a technician’s fully loaded annual labor cost is $120,000 and their allocated company overhead is $80,000 (total annual cost = $200,000), achieving a 20% net profit margin requires that individual technician to generate at least $250,000 per year ($200,000 / 0.80).
Action Plan: 5 Steps to Increase Tech Revenue by 20%–30%
Executing a structured 90-day operational roadmap allows HVAC business owners to eliminate field friction, lift billable hours, and systematically move underperforming technicians into higher revenue brackets. By fixing call dispatching, pricing accuracy, and incentive structures, field teams can increase annual revenue output without increasing technician burnout.
Focusing on high-leverage operational adjustments ensures long-term capacity management and steady gross margin expansion across every truck in your fleet.
1. Implement AI & Automated Call Qualification
Dispatching your top-tier diagnostic technicians or selling comfort advisors to low-margin $99 maintenance tune-ups wastes high-value labor capacity. Implementing automated call qualification protocols ensures high-intent repair and replacement leads are matched directly with your highest-producing field personnel.
Key action items for upgrading call qualification include:
- Script customer service representatives (CSRs) to identify system age, equipment condition, and customer intent during intake calls.
- Use automated dispatching rules to route high-probability replacement calls to senior selling technicians.
- Reserve junior maintenance technicians strictly for routine tune-ups, filter changes, and initial system inspections.
2. Shift Focus from Single Repairs to Maintenance Club Agreements
Relying on one-off emergency repair calls creates unpredictable revenue spikes and poor customer retention. Building a robust recurring maintenance agreement program builds a predictable baseline of off-season work while generating steady warm leads for future equipment changeouts.
Strategies for driving maintenance agreement conversion rates feature:
- Train field technicians to present maintenance membership benefits as a cost-saving alternative to standard diagnostic fees.
- Bundle annual service contracts with priority scheduling, system safety guarantees, and member-only parts discounts.
- Establish consistent technician SPIFFs ($15 to $25 per membership sold) to keep maintenance agreement growth top of mind.
3. Optimize Dispatching and Clustering for High Route Density
Reducing unbilled windshield time directly expands daily billing windows, allowing field technicians to run an extra service call per day without extending working hours. Maximizing route density relies on geographic call clustering and intelligent schedule management.
Tactics for improving dispatch optimization and drive-time efficiency involve:
- Restricting non-emergency service calls to specific geographic zones by day of the week.
- Utilizing field service software with dynamic GPS tracking to adjust schedules based on live traffic patterns.
- Deploying parts runners to deliver specialized components directly to job sites, keeping primary technicians billable in the field.
4. Introduce Performance-Based Incentive Pay (2%–3% Revenue Bonuses)
Aligning technician compensation with company performance goals motivates field staff to maintain high ticket sizes, present complete repair options, and eliminate callbacks. Transparent incentive pay structures reward high productivity while maintaining gross profit targets.
Designing effective technician incentive programs requires:
- Offering a 2% to 3% performance bonus on total gross revenue generated above a baseline monthly threshold.
- Structuring tier-based SPIFFs for successful handoffs that lead to completed system replacements.
- Conditioning bonus payouts on maintaining clean callback rates (under 3% to 5%) to ensure work quality remains high.
5. Conduct Annual Flat-Rate Price Book Audits
Failing to adjust field pricing for rising material costs, parts inflation, and wage increases continuously compresses gross margins over time. Conducting regular flat-rate pricing audits ensures every repair code accurately reflects current operating overhead.
Steps for conducting an effective pricing audit include:
- Review top-selling repair tasks every 6 to 12 months against current distributor parts pricing.
- Adjust target billable hourly rates to reflect updated fully loaded technician labor costs.
- Standardize digital price books across all technician tablets to prevent unauthorized field discounting.

Oscar Vance | Master Plumber & Drainage Expert
Meet Oscar Vance, a licensed master plumber sharing practical solutions on residential repairs, preventive maintenance, and thoughtful home upkeep.